Ai Cheat Sheet
  • Home
  • Statistics ↓↑
    • Types of Measure
    • Population and Sample
    • Outliers
    • Variance
    • Standard Deviation
    • Skewness
    • Percentiles
    • Deciles
    • Quartiles
    • Box and Whisker Plots
    • Correlation and Covariance
    • Hypothesis Test
    • P Value
    • Statistical Significance
    • Bootstrapping
    • Confidence Interval
    • Central Limit Theorem
    • F1 Score (F Measure)
    • ROC and AUC
    • Random Variable
    • Expected Value
    • Central Limit Theorem
  • Probability ↓↑
    • What is Probability
    • Joint Probability
    • Marginal Probability
    • Conditional Probability
    • Bayesian Statistics
    • Naive Bayes
  • Data Science ↓↑
    • Probability Distribution
    • Bernoulli Distribution
    • Uniform Distribution
    • Binomial Distribution
    • Poisson Distribution
    • Normal Distribution
    • T-SNE
  • Data Engineering ↓↑
    • Data Science vs Data Engineering
    • Data Architecture
    • Data Governance
    • Data Quality
    • Data Compliance
    • Business Intelligence
    • Data Modeling
    • Data Catalog
    • Data Cleaning
    • Data Format
      • Apache Avro
    • Tools
      • Data Fusion
      • Dataflow
      • Dataproc
      • BigQuery
    • Cloud Platforms
      • GCP
    • SQL
      • ACID
      • SQL Transaction
      • Query Optimization
    • Data Engineering Interview Questions
  • Vector and Matrix
    • Vector
    • Matrix
  • Machine Learning ↓↑
    • L1 and L2 Loss Function
    • Linear Regression
    • Logistic Regression
    • Naive Bayes Classifier
    • Resources
  • Deep Learning ↓↑
    • Neural Networks and Deep Learning
    • Improving Deep Neural Networks
    • Structuring Machine Learning Projects
    • Convolutional Neural Networks
    • Sequence Models
    • Bias
    • Activation Function
    • Softmax
    • Cross Entropy
  • Natural Language Processing ↓↑
    • Linguistics and NLP
    • Text Augmentation
    • CNN for NLP
    • Transformers
      • Implementation
  • Computer Vision ↓↑
    • Object Localization
    • Object Detection
    • Bounding Box Prediction
    • Evaluating Object Localization
    • Anchor Boxes
    • YOLO Algorithm
    • R-CNN
    • Face Recognition
  • Time Series
    • Resources
  • Reinforcement Learning
    • Reinforcement Learning
  • System Design
    • SW Diagramming
    • Feed
  • Tools
    • PyTorch
    • Tensorflow
    • Hugging Face
  • MLOps
    • Vertex AI
      • Dataset
      • Feature Store
      • Pipelines
      • Training
      • Experiments
      • Model Registry
      • Serving
        • Batch Predictions
        • Online Predictions
      • Metadata
      • Matching Engine
      • Monitoring and Alerting
  • Interview Questions ↓↑
    • Questions by Shared Experience
  • Contact
    • My Personal Website
Powered by GitBook
On this page
  • Entropy
  • Cross-Entropy Loss Function
  • Categorial Cross-Entropy Loss
  • Binary Cross-Entropy Loss

Was this helpful?

  1. Deep Learning ↓↑

Cross Entropy

PreviousSoftmaxNextLinguistics and NLP

Last updated 4 years ago

Was this helpful?

Entropy

Entropy of a random variable X is the level of uncertainty inherent in the variables possible outcome.

H(X)=−∑xp(x)log⁡p(x)H(X) = -\sum_x p(x) \log p(x)H(X)=−x∑​p(x)logp(x)

Cross-Entropy loss is an important cost function. It is used to optimize classification models. The understanding of Cross-Entropy is pegged on understanding of Softmax activation function.

Consider a 4-class classification task where an image is classified as either a dog, cat, horse, or cheetah.

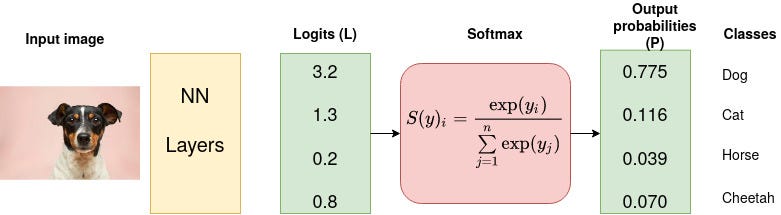
In the above Figure, Softmax converts logits into probabilities. The purpose of the Cross-Entropy is to take the output probabilities (P) and measure the distance from the truth values (as shown in Figure below).

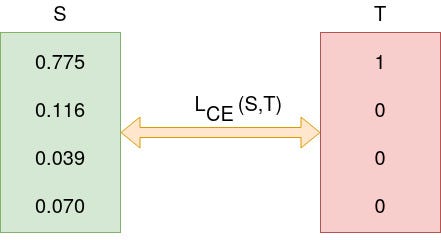
For the example above the desired output is [1,0,0,0] for the class dog but the model outputs [0.775, 0.116, 0.039, 0.070] .

Cross-Entropy Loss Function

Also called logarithmic loss, log loss or logistic loss. Each predicted class probability is compared to the actual class desired output 0 or 1 and a score/loss is calculated that penalizes the probability based on how far it is form the actual expected value. The penalty is logarithmic in nature yielding a large score for large differences close to 1 and small score for small differences tending to 0. Cross-entropy is defined as,

Categorial Cross-Entropy Loss

Assume that after some iterations of model training the model outputs the following vector of logits
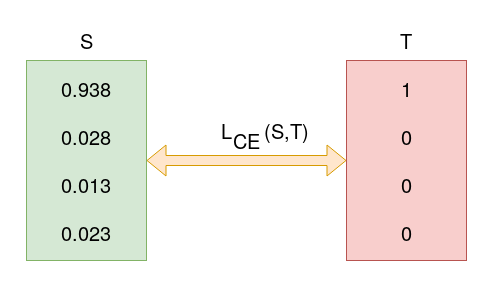
Binary Cross-Entropy Loss

If there are just two class labels, the probability is modeled as the Bernoulli distribution for the positive class label. This means that the probability for class 1 is predicted by the model directly, and the probability for class 0 is given as one minus the predicted probability, for example,

Image for post
Lce=−∑i=1nyilog⁡(pi)L_{ce} = - \sum_{i=1}^n y_i \log(p_i)Lce​=−i=1∑n​yi​log(pi​)
L=−∑i=14Yilog⁡(Si)=−[1log⁡2(0.775)+0log⁡2(0.116)+0log⁡2(0.039)+0log⁡2(0.070)]=0.3677L=-\sum_{i=1}^4 Y_i \log (S_i) \\ = - [1\log_2(0.775) + 0\log_2(0.116) + 0\log_2(0.039) + 0\log_2(0.070)] \\ = 0.3677L=−i=1∑4​Yi​log(Si​)=−[1log2​(0.775)+0log2​(0.116)+0log2​(0.039)+0log2​(0.070)]=0.3677
Image for post
L=−1log⁡2(0.938)+0+0+0=0.095L = - 1 \log_2(0.938)+0+0+0 = 0.095L=−1log2​(0.938)+0+0+0=0.095
L=−∑i=12yilog⁡(pi)=−[yilog⁡(yi^)+(1−yi)log⁡(1−yi^)]L= - \sum_{i=1}^2 y_i \log(p_i) = -[y_i \log( \hat{y_i}) + (1-y_i) \log(1-\hat{y_i})]L=−i=1∑2​yi​log(pi​)=−[yi​log(yi​^​)+(1−yi​)log(1−yi​^​)]
Cross-Entropy Loss FunctionMedium
A Gentle Introduction to Cross-Entropy for Machine Learning - Machine Learning MasteryMachine Learning Mastery
Logo
Logo