> For the complete documentation index, see [llms.txt](https://ai.nuhil.net/llms.txt). Markdown versions of documentation pages are available by appending `.md` to page URLs; this page is available as [Markdown](https://ai.nuhil.net/system-design/feed.md).
# Feed
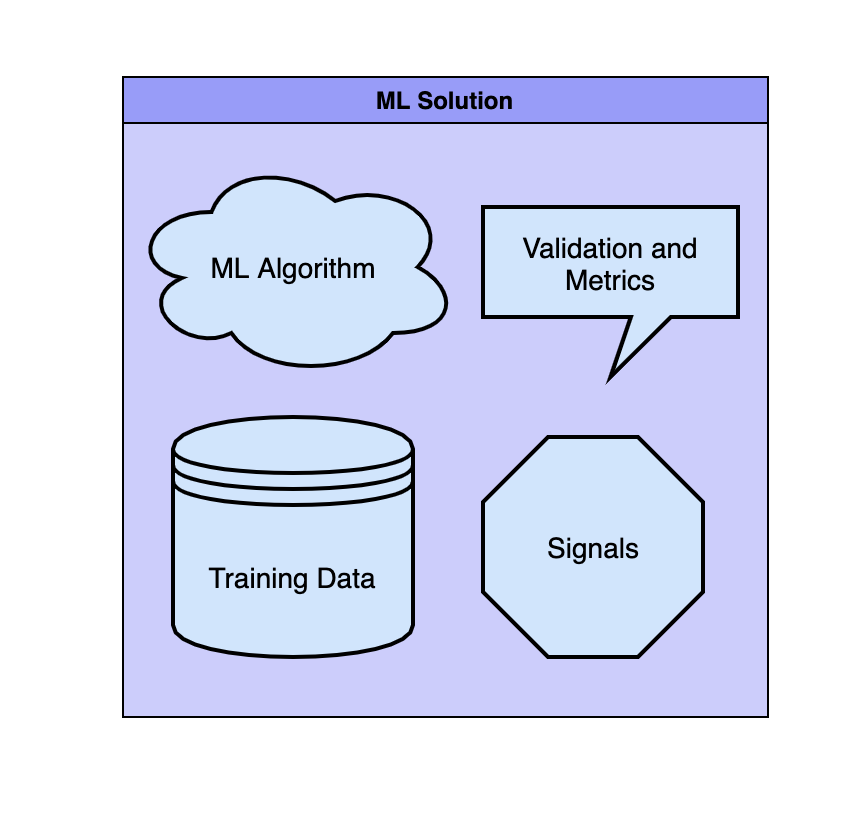
**Each ML solution has four major parts:**
* Machine learning algorithm
* Training data
* Signals (sometimes called features)
* Validation and Metrics
For **algorithms**, what algorithm will you choose and why? Deep learning, linear regression, random forest? What are the strengths and weaknesses for each? What do they accomplish per your system’s needs?
For **data**, where will you get test data? What data points will you draw from? How many data points will you handle?
For **signals**, what metric does your program use to determine relevant data? Will you signal to focus on one aspect of the data or synthesize it from multiple? How long does it take to determine data relevancy?
For **metrics**, what metrics will you track for success and program learning? How would you measure the success of your system? How will you validate your hypothesis?
**5 Steps to solve any ML system design problem**
**Our question is: Create a content feed to display personalized posts to users.**

**Step 1: example**
If we were clarifying the feed question, we’d ask:
* What type of feed will this be? Purely text? Text and images?
* How many users do we expect to have? How many posts does each make per day?
* What metric does our system optimize for? Do we want more engagement per post or to increase the number of posts?
* Do we have a target latency?
* How quickly will our system apply new learning?
**Step 2: example**
We’d write that our training data is from our current social media platform. Fresh live data will enter the system each time a new post is created based on the creator’s location, the popularity of the creator’s past posts, and the accounts that follow that creator.
We’ll use these metrics to determine how relevant a post is to a user. Relevancy will be determined when the app is launched. Our goal is to increase engagement per post.
**Step 3: example**
We’ll expect each user to follow 300 accounts and each account to make an average of 3 posts per day. We’ll have three layers of data evaluation to keep latency low when the system evaluates the 1000 posts. The first layer quickly cuts a majority of posts based on the post-popularity.
The second layer uses locational data to cut posted based on locality, this is our second quickest layer. The third layer will be the longest and will cut posts using cross-engagement data between the follower and followed.
**Step 4: example**
We’ll use the feedforward neural network algorithm to predict relevancy. This algorithm works well with our creator/user interactions signal because it forms predictions off of non-circular connection webs.
**Step 5: example**
Our relevancy-based feed will increase user engagement by 0.5%. We’ll first use offline models programmed to simulate users and see what types of posts come through to the feed.
Once we move online, we’ll track posts with the keyword “update” and “relevance” to determine effectiveness.
{% embed url="" %}